Transformando o feedback dos usuários em insights práticos de UX com IA

Pesquisa

Design UX/UI

Artificial Intelligence

Agentic AI

Eu projetei um fluxo de trabalho baseado em IA para transformar feedbacks brutos de CSAT e CES em insights acionáveis de UX. O que começou como uma análise manual para um único time se tornou um sistema reutilizável adotado por vários times, reduzindo o tempo de análise de ponta a ponta em 95%.

Resumo

Sobre o produto

O projeto foi desenvolvido para uma plataforma interna de testes de API utilizada por desenvolvedores, engenheiros de frontend e backend, profissionais de QA e testadores em um grande banco brasileiro.

A plataforma atua em um segmento semelhante ao de ferramentas como Postman ou Insomnia, permitindo que equipes técnicas testem APIs, gerem dados mockados, analisem requisições e apoiem diferentes etapas do fluxo de desenvolvimento de software.

À medida que a plataforma evoluiu e se expandiu para múltiplos produtos, as pesquisas de satisfação do cliente tornaram-se uma importante fonte de insights para identificar problemas de usabilidade e oportunidades de melhoria.

Meu papel

Trabalhei em Design de Produto, Pesquisa de UX, engenharia de prompt de IA, design de fluxo e desenvolvimento frontend.

Minhas responsabilidades incluíram:

• Analisar pesquisas de CSAT e CES
• Definir a estrutura para interpretar feedbacks qualitativos e quantitativos
• Desenhar o fluxo de trabalho de pesquisa assistida por IA
• Identificar oportunidades de UX e usabilidade
• Estruturar a arquitetura de informação do dashboard
• Prototipar e gerar a interface com o Figma Make
• Refinar manualmente o frontend e o CSS gerados
• Definir a estrutura de dados e do JSON consumidos pelo dashboard
• Criar uma habilidade de IA reutilizável para futuros ciclos de pesquisa

Sobre a persona do usuário

Os principais usuários da plataforma eram profissionais técnicos envolvidos no desenvolvimento de software:

• Desenvolvedores frontend
• Desenvolvedores backend
• Desenvolvedores full stack
• Profissionais de QA
• Analistas de teste de software

Para o sistema de análise de feedback, os principais usuários eram as equipes de produto e tecnologia responsáveis por compreender a satisfação do cliente e apresentar as descobertas da pesquisa.

Suas principais necessidades eram compreender rapidamente:

• Como os usuários percebiam o produto
• O que estava funcionando bem
• O que estava causando atrito
• Quais problemas eram recorrentes
• O que poderia ser melhorado
• Quais oportunidades deveriam receber investigação mais aprofundada

Discovery

O problema

A equipe já coletava feedbacks valiosos dos clientes por meio de pesquisas de CSAT e CES, o problema era o que acontecia depois que os dados eram coletados.

As pesquisas chegavam como planilhas contendo notas, comentários, reclamações, elogios e sugestões. Transformar esses dados brutos em insights úteis de produto exigia um longo processo manual:

Analisar → Comparar → Categorizar → Encontrar padrões → Identificar problemas de UX → Sugerir melhorias → Validar → Criar apresentação

Esse processo tornou-se cada vez mais ineficiente à medida que o número de ciclos de pesquisa e produtos crescia. O desafio, portanto, não era simplesmente analisar o feedback dos clientes mais rapidamente. Era criar uma maneira repetível de transformar o feedback dos clientes em inteligência de produto acionável.

A pesquisa

A pesquisa combinou dados quantitativos e qualitativos de pesquisas de CSAT e CES.

Sinais quantitativos

Analisei as pontuações de satisfação e esforço para entender a percepção geral do produto e identificar áreas que exigiam uma investigação mais aprofundada.

Sinais qualitativos

Analisei os comentários dos clientes para identificar:

• Elogios

• Reclamações

• Pontos de dor recorrentes

• Problemas de usabilidade

• Expectativas dos usuários

• Sugestões

• Oportunidades de melhoria do produto

Em vez de tratar os comentários individuais como feedbacks isolados, busquei padrões recorrentes que pudessem indicar problemas mais amplos de UX.

O objetivo era passar de:

A pesquisa combinou dados quantitativos e qualitativos de pesquisas de CSAT e CES.

Sinais quantitativos

Analisei as pontuações de satisfação e esforço para entender a percepção geral do produto e identificar áreas que exigiam uma investigação mais aprofundada.

Sinais qualitativos

Analisei os comentários dos clientes para identificar:

• Elogios

• Reclamações

• Pontos de dor recorrentes

• Problemas de usabilidade

• Expectativas dos usuários

• Sugestões

• Oportunidades de melhoria do produto

Em vez de tratar os comentários individuais como feedbacks isolados, busquei padrões recorrentes que pudessem indicar problemas mais amplos de UX.

O objetivo era passar de:

“O que os usuários disseram?”

to

“What patterns can we identify, and what should the product team do about them?”

Delivery

Projetando o fluxo de trabalho assistido por IA

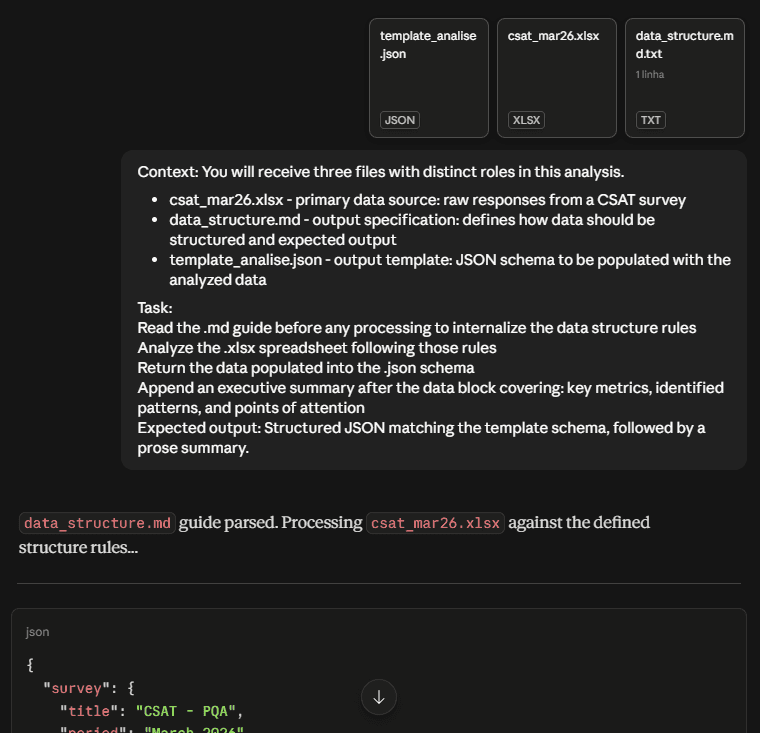
Em vez de usar a IA apenas como uma ferramenta de sumarização, projetei um fluxo de trabalho onde a IA apoiou toda a transição de pesquisas brutas para insights de produto estruturados.

O processo tornou-se:

Dados brutos da pesquisa → Análise de IA → Padrões e pontos de dor → Oportunidades de UX →

Resultado de pesquisa estruturado → Painel interativo

Dados brutos da pesquisa → Análise de IA →

Padrões e pontos de dor →

Oportunidades de UX →

Resultado de pesquisa estruturado →

Painel interativo

Dados brutos da pesquisa → Análise de IA → Padrões e pontos de dor → Oportunidades de UX →

Resultado de pesquisa estruturado → Painel interativo

This approach reduced the amount of repetitive analysis while maintaining a consistent structure across research cycles.


From analysis to structured data

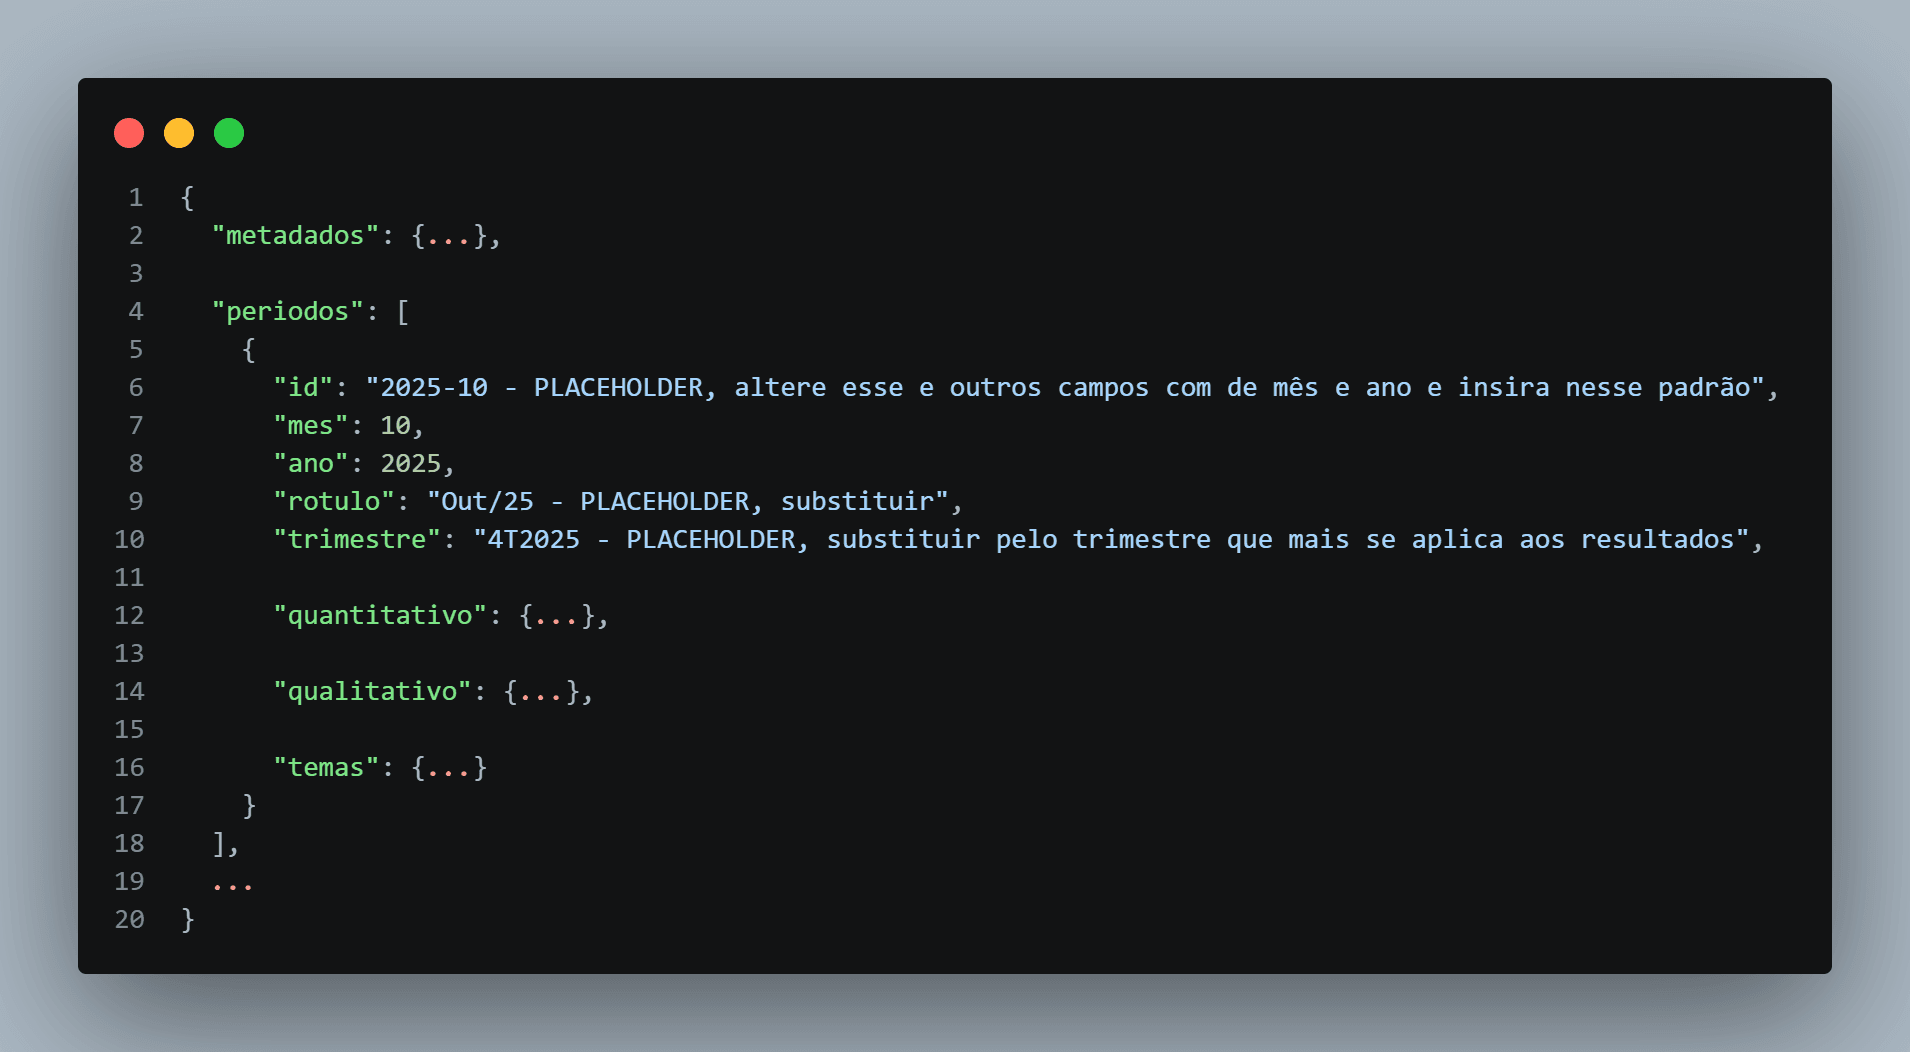
After the AI analysis, I generated a structured Markdown document containing the research findings. This created a consistent intermediate representation of the research before it reached the interface.

Em seguida, defini uma estrutura JSON padronizada contendo as informações exigidas pelo painel. Este foi um passo importante porque separou a pesquisa em si da interface. O painel não precisava entender como a pesquisa foi gerada, apenas precisava receber os dados na estrutura esperada.
Decisões de interface

Transformando pesquisas em uma experiência explorável

Usei o Figma Make para transformar as descobertas estruturadas da pesquisa em um painel interativo.

Em vez de apresentar a pesquisa como um relatório longo, organizei as informações em várias visualizações que permitiram aos usuários analisar rapidamente os resultados gerais e, em seguida, explorar áreas específicas.


The dashboard brought together:

• CSAT and CES scores
• Positive and negative feedback
• Main complaints
• Recurring pain points
• UX and usability opportunities
• User suggestions
• Recommended improvements
• Supporting customer comments


The information architecture was designed around the questions stakeholders typically needed to answer:

"Quão satisfeitos estão os usuários?"

"Com o que eles estão tendo dificuldades?"

"O que eles estão elogiando?"

"Quais problemas continuam aparecendo?"

"O que nós devemos melhorar?"

This transformed the research from a static deliverable into an interface for exploring product intelligence.


From one dashboard to a reusable system

A key design decision was to avoid building a one off dashboard and rebuilding it later on. I wanted the interface to work as a reusable container for future research. To achieve this, I created a defined data structure that the dashboard could consume.

The workflow became:

Nova pesquisa → IA analisa os dados → IA retorna a estrutura JSON predefinida →

Dashboard consome os novos dados → Insights atualizados ficam disponíveis

Nova pesquisa → IA analisa os dados → IA retorna a estrutura JSON predefinida →

Dashboard consome os novos dados → Insights atualizados ficam disponíveis

This meant that future research could update the existing experience without requiring the dashboard to be redesigned or rebuilt, while maintaining the score history.

AI as part of the design workflow

Figma Make accelerated the creation and iteration of the dashboard, but it was not treated as a black box. When the available Figma Make credits were exhausted, I continued the implementation manually.

I made adjustments directly to:

• Frontend code

• CSS

• Data files

• JSON structures

• Interface behavior

• Content and information structure

The AI generated output was therefore treated as a starting point for iteration, rather than the final product.


AI as part of the design workflow

Figma Make accelerated the creation and iteration of the dashboard, but it was not treated as a black box. When the available Figma Make credits were exhausted, I continued the implementation manually.

I made adjustments directly to:

• Frontend code

• CSS

• Data files

• JSON structures

• Interface behavior

• Content and information structure

The AI generated output was therefore treated as a starting point for iteration, rather than the final product.

Limiting factors

Balancing AI speed with design control

Generative tools accelerated the initial implementation considerably, but they also introduced limitations in consistency, structure, and control over the generated output.

I had to manually review and refine the generated interface to ensure that the experience matched the intended information architecture.

Balancing AI speed with design control

Generative tools accelerated the initial implementation considerably, but they also introduced limitations in consistency, structure, and control over the generated output.

I had to manually review and refine the generated interface to ensure that the experience matched the intended information architecture.


Keeping the data structure stable

Because the dashboard depended on structured AI generated data, the format had to be predictable.

This led to the creation of a standardized JSON structure that acted as a contract between the AI analysis and the interface. This was critical for making the system reusable.


Keeping the data structure stable

Because the dashboard depended on structured AI generated data, the format had to be predictable.

This led to the creation of a standardized JSON structure that acted as a contract between the AI analysis and the interface. This was critical for making the system reusable.


Keeping the data structure stable

Because the dashboard depended on structured AI generated data, the format had to be predictable.

This led to the creation of a standardized JSON structure that acted as a contract between the AI analysis and the interface. This was critical for making the system reusable.


Moving beyond a one off solution

The initial challenge could have been solved with a single dashboard or report. However, doing so would have preserved the manual work for the next research cycle.

The larger design challenge was therefore creating a system that could continue generating value after the initial delivery.


Moving beyond a one off solution

The initial challenge could have been solved with a single dashboard or report. However, doing so would have preserved the manual work for the next research cycle.

The larger design challenge was therefore creating a system that could continue generating value after the initial delivery.


Moving beyond a one off solution

The initial challenge could have been solved with a single dashboard or report. However, doing so would have preserved the manual work for the next research cycle.

The larger design challenge was therefore creating a system that could continue generating value after the initial delivery.

Resultados

95% reduction in end to end analysis time

The workflow reduced the total time required to complete the research analysis by approximately 95%.

This reduction covered the complete process, including:

• Analyzing survey data

• Comparing and organizing information

• Identifying patterns

• Generating the dashboard

• Identifying UX and usability improvements

• Translating suggestions into product opportunities

• Performing general validation

The impact was therefore not limited to AI assisted analysis. It affected the entire research-to-presentation workflow.

95% reduction in end to end analysis time

The workflow reduced the total time required to complete the research analysis by approximately 95%.

This reduction covered the complete process, including:

• Analyzing survey data

• Comparing and organizing information

• Identifying patterns

• Generating the dashboard

• Identifying UX and usability improvements

• Translating suggestions into product opportunities

• Performing general validation

The impact was therefore not limited to AI assisted analysis. It affected the entire research-to-presentation workflow.


Adoption beyond the original squad

The solution was initially created for one squad, but after demonstrating its impact, the approach was requested and adopted by additional squads.

The system evolved from a solution for a single product into a reusable approach that could support multiple products and research cycles. The dashboard became part of the product satisfaction presentation workflow and is used by over 30 people, including developers, POs, PMs and Head of division.


Adoption beyond the original squad

The solution was initially created for one squad, but after demonstrating its impact, the approach was requested and adopted by additional squads.

The system evolved from a solution for a single product into a reusable approach that could support multiple products and research cycles. The dashboard became part of the product satisfaction presentation workflow and is used by over 30 people, including developers, POs, PMs and Head of division.


Adoption beyond the original squad

The solution was initially created for one squad, but after demonstrating its impact, the approach was requested and adopted by additional squads.

The system evolved from a solution for a single product into a reusable approach that could support multiple products and research cycles. The dashboard became part of the product satisfaction presentation workflow and is used by over 30 people, including developers, POs, PMs and Head of division.


Reusable by design

The most important result was not the dashboard itself, it was the whole system behind it. New research can be analyzed using the same AI workflow and returned in the predefined data format, allowing the existing dashboard to be continuously updated.

"One research cycle → one dashboard" became "One system → multiple products → multiple research cycles"


Reusable by design

The most important result was not the dashboard itself, it was the whole system behind it. New research can be analyzed using the same AI workflow and returned in the predefined data format, allowing the existing dashboard to be continuously updated.

"One research cycle → one dashboard" became "One system → multiple products → multiple research cycles"


Reusable by design

The most important result was not the dashboard itself, it was the whole system behind it. New research can be analyzed using the same AI workflow and returned in the predefined data format, allowing the existing dashboard to be continuously updated.

"One research cycle → one dashboard" became "One system → multiple products → multiple research cycles"

Conclusão

Este projeto é um exemplo de como eu abordo a IA no Design de Produto.

A oportunidade inicial parecia ser um problema de análise de pesquisa, mas o problema mais profundo era um problema de fluxo de trabalho.

Em vez de simplesmente pedir à IA para analisar os feedbacks dos clientes, eu projetei um sistema conectando:

Pesquisa + IA + Insights estruturados + Interface gerada por IA + Decisões de produto + Insights de UX

O resultado foi uma redução de 95% no tempo de análise de ponta a ponta, a adoção além da equipe original e um sistema reutilizável que poderia continuar apoiando futuros ciclos de pesquisa.

Para mim, a principal lição foi que o valor da IA no Design de Produto não está apenas em gerar resultados mais rapidamente, mas em projetar sistemas e fluxos de trabalho em torno desses resultados para que eles possam ser confiáveis, reutilizáveis e conectados a decisões de produtos reais.

Matheus Gomes / 2025

Create a free website with Framer, the website builder loved by startups, designers and agencies.